Layers of Protection Analysis
Layers of Protection Analysis (LOPA) is a useful tool often used to assess the risk of major accidents. It is most commonly used within the process industries however the general approach is applicable for any type of risk assessment. LOPA is a semi-quantitative method meaning that an ‘order of magnitude’ approximation approach is used to derive frequency estimates, and therefore risk, for event consequences. The estimates of risk are limited to the single event being studied and will deal only with credible worst-case consequences of the event.
As a risk assessment tool, LOPA fits in between simplified qualitative techniques (such as simple risk matrix) and complete quantitative assessment (QRA). LOPA would be a good choice as a risk assessment approach where a higher degree of risk quantification is required due to the potential severity of the consequences, but where there is no need for a full quantitative assessment. The time and cost to complete a LOPA is greater than a simplified qualitative analysis but far less than QRA. LOPA also provides very clear linkages between causes, controls and outcomes, considers the effectiveness of individual controls and can be used to demonstrate that the controls are adequate using simple risk criteria. These are key requirements of any major hazards safety case so the benefit of this tool for major hazard risk assessment is obvious. The scenario risk determined through the LOPA may also be plotted onto the company risk matrix which helps to communicate the results to employees who are already familiar with the risk matrix.
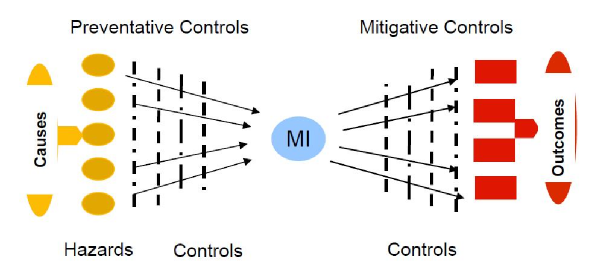
A key aspect of the LOPA methodology involves identifying the ‘preventative’ controls which prevent the hazard leading to an accident (the ‘loss of control’ event) and the ‘mitigating’ controls which help to reduce the magnitude or severity of an incident once it has occurred. These are referred to as the ‘layers of protection’. The layers of protection are identified explicitly and assigned probabilities of failure based on estimates of effectiveness and reliability. The estimated initiating event frequency and control failure probabilities may then be combined to generate the frequency estimates for accident outcomes. These frequency estimates may then be compared to “target” risk criteria and plotted onto a risk matrix if desired.
Where further risk reduction is required to meet tolerance criteria, the LOPA method helps to identify the performance level required from additional or alternative control measures in order to meet the risk target. An added benefit is that the results from the LOPA may be used to specify performance requirements for existing or new control measures such as SIL requirement for safety instrumented systems.
LOPA studies may also be presented in a bowtie diagram as shown which is an easily understood method of communicating the risk assessment results to employees.
LOPA studies are usually performed in small team facilitated workshops to ensure an appropriate balance of technical and operational skills are available. R4Risks’ facilitators have conducted many LOPA studies across a broad range of industries, and have the experience and skill to maximise the efficiency of the LOPA study. As part of R4Risk’s services, a technical secretary (scribe) and software can be provided for the recording of the LOPA results.