Our Services
Bowtie Analysis

Bowtie Analysis for Risk Prevention
Bowtie Analysis: A Clear and Accessible Way to Communicate Risk
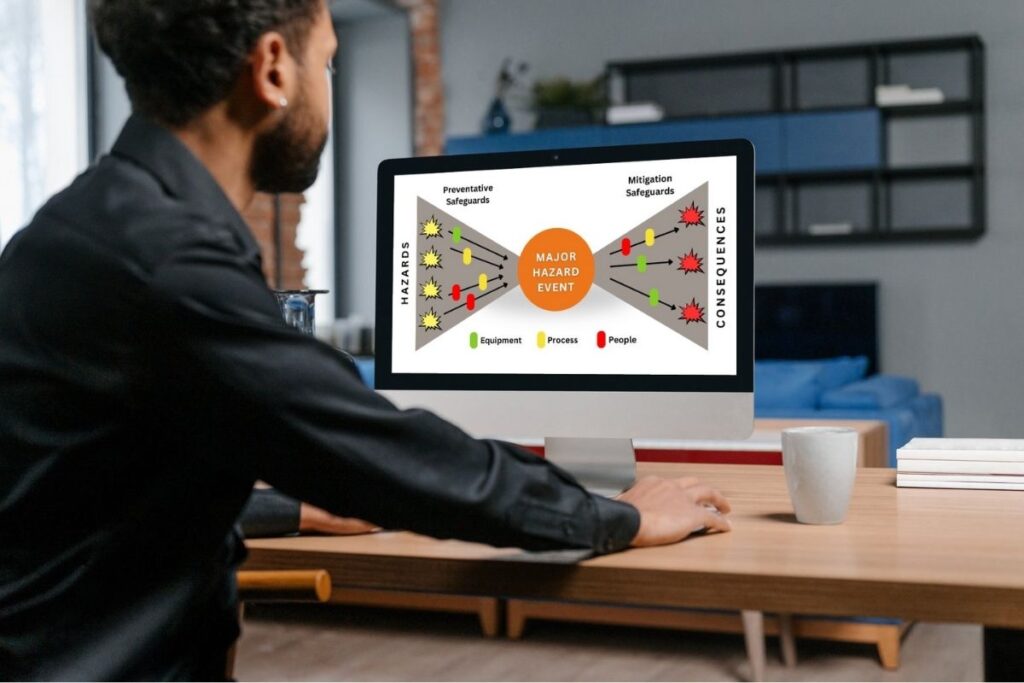
Bowtie analysis is a simple and effective tool for communicating risk assessment results to stakeholders. The subsequent diagrams clearly display the links between the potential causes, preventative and mitigative controls and consequences of a catastrophic event. This type of analysis allows for:
- Determining whether hazards are sufficiently controlled
- Easy identification of the hazards driving the risk for action prioritisation
- The whole risk assessment to be summarised on a single page
- Communication of risk assessment results and risk concepts leading to heightened awareness of major risks
Bowtie Analysis with R4Risk
Using Bowtie Analysis for Ongoing Risk Management
R4Risk’s bowtie analysis process can be effectively used to develop a risk-based platform for the ongoing management and prevention of major incidents. It delivers the following benefits:
- Draws on the direct involvement and experience of facility personnel to identify hazards and to properly incorporate critical controls into management systems
- Enables risk-based monitoring, auditing and review of critical risk controls
- Raises awareness and improves understanding and knowledge among employees of the potential major incidents and the reliance on critical controls that prevent those accidents from occurring
- Enables proper risk management to be demonstrated
- Contributes to achieving legislative compliance.

Bowtie Analysis
Frequently Asked Questions
No, R4Risk can provide templates in specific bowtie software, such as Bowtie XP and Velocity EHS RiskView, or in Microsoft programs. R4Risk can also provide recommendations on which program may best suit your needs.
The most important aspect is the correct application of the bowtie assessment methodology.
No. The bowtie analysis process can be applied to any type of risk (e.g. financial, environmental, safety). As bowtie workshops are resource intensive, they are typically used to address the highest risk events. The scope of the bowtie analysis needs to be clearly defined for efficient application.
Bowtie diagrams should be ‘operationalised’ – they are active documents that are integrated into everyday systems of work. Bowtie diagrams are primarily used to:
- Communicate risk assessments as the visual diagrams are more easily understood than reading through spreadsheets.
- Identify the controls that prevent or mitigate a catastrophic event for heightened management.
It should be noted that the bowtie diagram is a model of the risk on site. The implementation of the information from the analysis (i.e. control management, risk reduction actions) maintains the ‘truth’ of the bowtie and makes a tangible difference to the site risk profile.
Bowtie diagrams can be used to:
- Identify the hazards driving the risk for targeted risk reduction actions and efficient resource management
- Identify hazards that are not adequately controlled
- Develop control assurance audits on particular events or areas of the plant
- Identify a list of controls for heightened maintenance and assurance
- Assess the risk when controls are taken out of service
- Communicate the importance of controls to prevent catastrophic events to operations
- Demonstrate adequate risk management to Regulatory Authorities

